Building Visual SQL Queries with Node Graphs
Introduction to NodeSQL
The goal of this project is to create a graphical interface that allows users to construct SQL queries without writing any SQL code. I know that nowadays there are tons of people who need to use SQL databases but just never had the time to learn SQL. A visual query construction tool could be very useful for non-technical users who want to be able to acces a SQL database, or even for users who have an prefer a visualization over a string of text. SQL queries can get confusing and verbose, and NodeSQL aims to fix that by providing an intuitive graphical environment for building SQL queries. This project is just a proof of concept and is very much in its early stages, but it is a great way to demonstrate the potential of visual query building using node graphs.
What is a node graph?
NodeSQL’s interface is based on a node graph, which is a series of nodes that are connected to each other with links. It is extremely similar to any other directed graph.
A node graph is comprised of nodes that are connected to each other with links, similar to a set of vertices connected to each other by edges. Each node (equivelent to a vertex) has inputs and outputs, and is responsible for performing some sort of computation on data, while links (equivelent to an edge) are responsible for transferring data from node to node. You can think of it as information flowing through pipes, and at each node the information is altered in some way. You may be familiar with this type of graph from applications such as Blender or Unreal Engine.
In NodeSQL, nodes can represent a SQL schema, a SQL operation, or serve as an endpoint for a query.
So, how does NodeSQL work?
The user is presented with a number of nodes that they can use. As of now, there are six types of nodes: entity, filter, count, ForEach, projection, and display. If NodeSQL were complete, there would be enough nodes to be able to build any SQL query possible, but for now, there is limited functionality. The process begins with the user placing down an entity node, connecting it to other operation nodes, and then relaying all of the information to the display node, where the user can see the result of their query.
Entity Node
The entity node represents a table or schema in a SQL database. It is the starting point for a query, and where all of the data comes from. For this project, I am using an example database filled with Sailor entities. The sailor entity has the following attributes: sid, sname, age and rank.
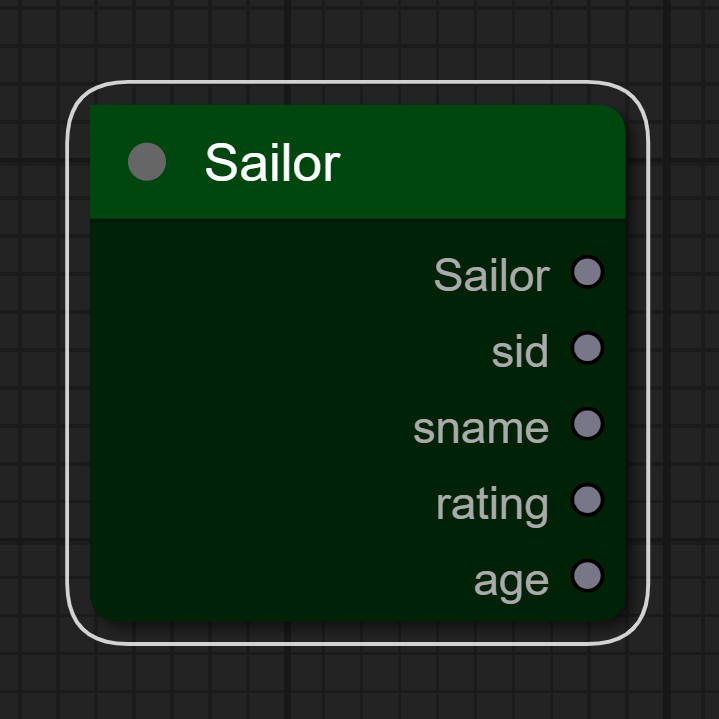
The output of this node is every sailor in the database.
Operation Nodes
Once an entity node is placed, a number of nodes can be used to perform operations on the data. These operations that are currently built are: filter, count, ForEach, and projection.
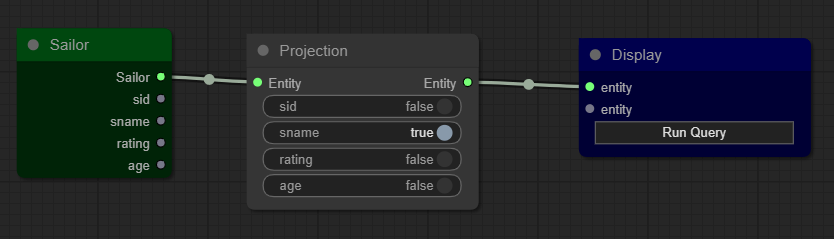
The count node is relatively simple, it outputs the amount of entities that are provided at the input. The projection node is also simple; it passes along all of the entities but only some of their attributes. The attributes that get passed can be selected on the projection node, as shown below.
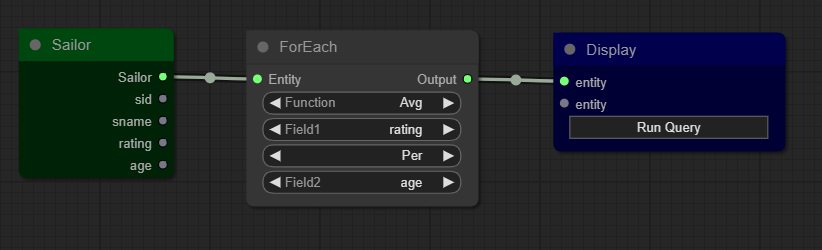
The ForEach node is a bit more complex, and it aims to replicate aggregation functions as well as the GROUP BY clause in SQL. Aggregation functions include AVG, SUM, MIN, MAX and COUNT. This node takes the entities, and aggregates the data based on a certain field and operation. For example, if a user wanted the average ranking for every age, they would construct a query that looks like this:
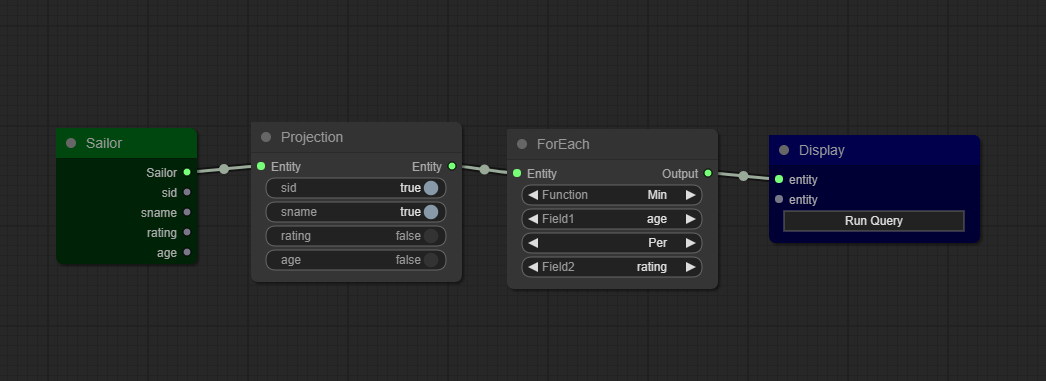
Another example would be getting the names and IDs of the youngest sailor per rating. The SQL query would look like this:
select rating, sname, sid, age from (select rating, sid, sname, age, rank() over (partition by rating order by age) as r from sailors) as t where r=1;
Here is what is would look like in NodeSQL:
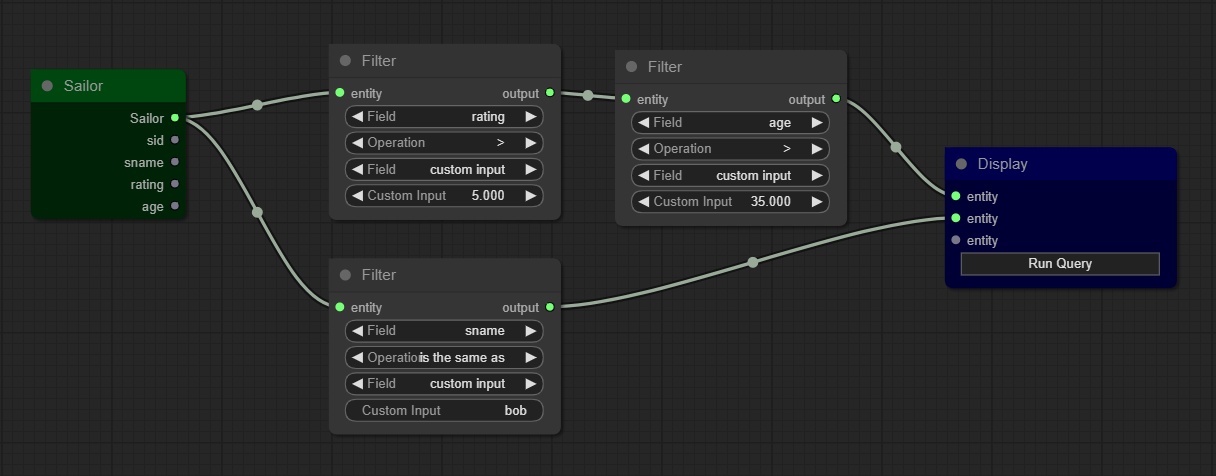
Finally, arguably the most common node is the filter node, which can be compared to the WHERE clause in SQL. Filters only pass data that meet a certain condition. Filter nodes can be cascaded and split, which could result in some really complex queries. Luckily, those queries don’t look too complex on a node graph. For example, if a user wanted to get all of the sailors who have a rating higher than 5 and an age higher than 35, or whose name is bob, the SQL query would look like this:
select * from sailors where (rating > 5 and age > 35) or (name = 'bob')
It is not a horribly complex query, but can be easily visualized in a node graph:
Some Technical Details
The backend currently uses the SQLAlchemy ORM to construct the queries. The frontend is using react and an HTML5 Canvas library called litegraph.js. litegraph.js is able to serialize all of the data in the node graph, which I send to my python backend for processing. A depth first search is used to traverse every path from the entity node to the display node in order to detect which nodes are being used, and then it is just a matter of constructing the query objects in python.
Conclusion
I think that NodeSQL is far from complete, and even far from usable. However, I spent a lot of time thinking about how to structure the different nodes and discussing with my friends and colleagues how to make it usable and intuitive. After discussing with many people, the conclusion was to structure the nodes in such a way that they can be read out loud as an english sentence, so that anybody can look at a query and understand it.
If I were to build NodeSQL to completion, I would probably start from scratch and do a few things differently. First of all, I would build my own ORM. I spent way too much time trying to manipulate SQLAlchemy to make it work, and if I were to implement more nodes it would just make sense to build an ORM from scratch. Additionally, I would also build my own UI- litegraph.js is excellent, but there are a number of features that I would specifically need for NodeSQL, and a number of features that come with litegraph.js that I just don’t need.
Overall, I think NodeSQL was a nice experiment in visual query construction. It isn’t perfect, but it is a nice proof of concept for how a visual tool for SQL can be really useful.
Resources
- Thank you to litegraph.js
- Nodegraph Architecture
- SQLAlchemy